Why have traditional trade show metrics failed B2B marketers?
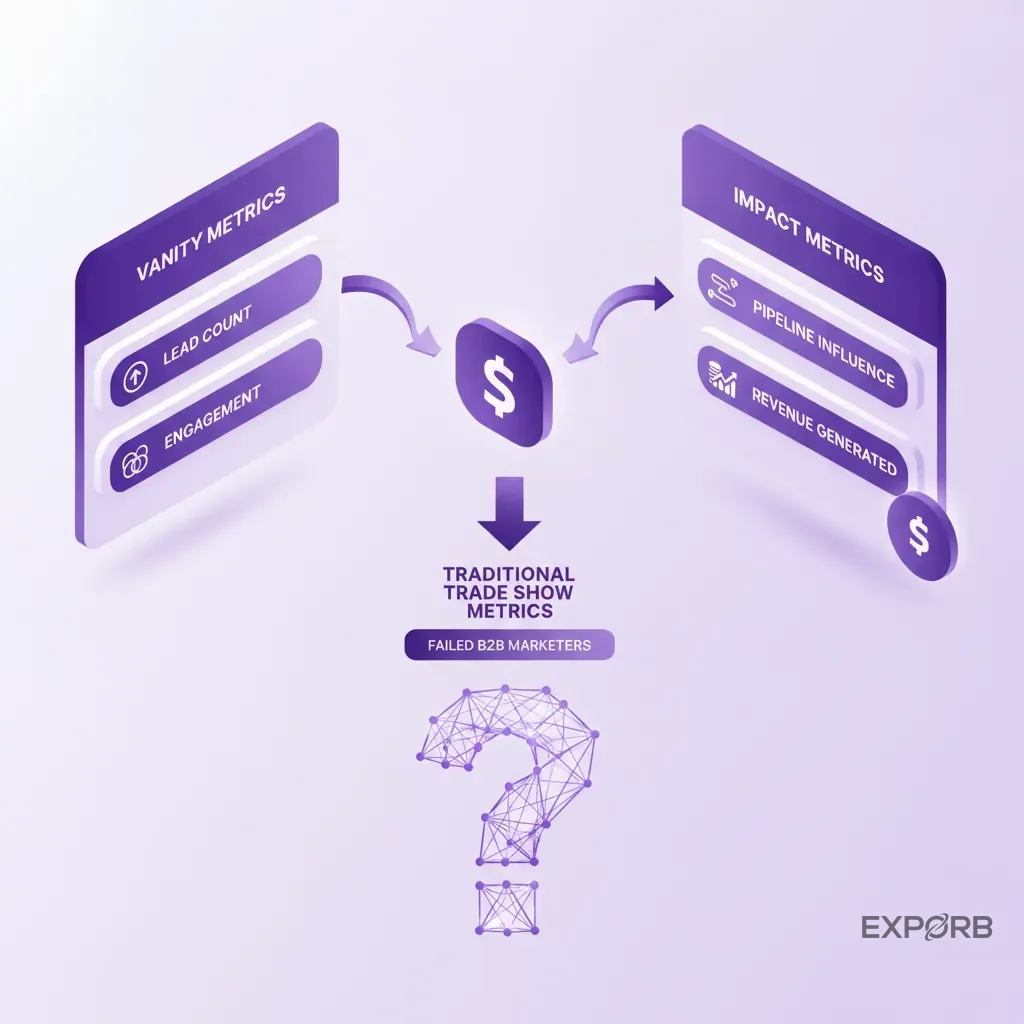
You just spent $100,000 on a trade show. Your team comes back with a fishbowl full of business cards and a spreadsheet of 500 badge scans. The C-suite asks, "What did we get for our money?" You show them the lead count. Everyone nods, but nobody really knows if it was a success. This is the broken feedback loop of Event Marketing, and it's why old-school Trade Show Analytics and reporting just don't cut it anymore. They measure activity, not impact. It's a common trap.
The U.S. B2B trade show market is a massive $15.8 billion industry, according to TradeShowPro's 2026 report. Yet most exhibitors still track success with metrics from 2006. They obsess over booth design and completely ignore lead capture. They'll spend $50K looking good and $0 on remembering what was actually said.
The limitations of vanity metrics like lead count and badge scans
A badge scan tells you a name, a title, and an email. It tells you nothing about intent, urgency, or pain. Was the person just grabbing free swag, or are they a decision-maker with a budget ready to solve the exact problem your product addresses? A simple lead count can't distinguish between the two. You end up with a bloated pipeline full of unqualified names your sales team wastes weeks chasing down. This is inefficient and expensive. You're paying your best reps to sift through digital noise instead of closing deals. It's a costly mistake.
The challenge of anecdotal feedback and delayed insights
What about qualitative feedback? Your team tells you they had "great conversations." But what does that mean? What was actually said? By the time your team gets back, writes up messy notes, and tries to remember the details of 100+ conversations, the context is gone. You lose important details—like a prospect mentioning their contract is up in Q3 or that they're frustrated with a specific competitor—forever. This delay means your follow-up is generic, and you base your understanding of the event's true value on fuzzy memories, not hard data. That's a problem.
The disconnect between event spend and pipeline revenue
This is the real killer. Events are important—a Cvent-cited report finds that 72% of marketers believe events are their most effective channel. But you can't prove it. You can't draw a straight line from the $100k event budget to the $500k in closed-won deals six months later. You can't. Period. Without that connection, they always cut your event budget first. You're left defending your spend with anecdotes instead of demonstrating concrete pipeline influence and ROI. That's a losing battle with any modern CFO.
What does a modern trade show analytics framework look like in 2026?
A modern analytics framework treats events as a core part of your revenue engine, not just isolated marketing expenses. It's about shifting your mindset from "how many leads did we get?" to "how much qualified pipeline did this event generate?"
This requires a complete rethinking of how you collect, analyze, and report on event data. It's no longer about a post-show data dump. It's a continuous flow of intelligence.
Moving from lead capture to revenue attribution
The goal is to capture a conversation—the context, the pain points, the buying signals, and the agreed-upon next steps. When you capture this level of detail, you can start attributing revenue directly to specific interactions at an event. You can see that a conversation about "scaling issues" at CES led to a demo, which then converted into a $150,000 ARR deal. That's a story your CFO understands. It's the difference between lead generation and pipeline creation.
Integrating pre-show, during-show, and post-show data streams
Your event analytics don't start when the doors open. They start the moment you book your first pre-show meeting. A modern framework integrates data from all three phases:
- Pre-show: Are you tracking which target accounts have booked meetings? Are you measuring engagement with your pre-event email campaigns?
- During-show: This is real-time data. Who is your team talking to right now? Which conversations are high-priority? How many qualified leads has each rep generated?
- Post-show: How quickly do leads get followed up with? What's the conversion rate from MQL (Marketing Qualified Lead) to SQL (Sales Qualified Lead)? What's the sales cycle velocity for event-sourced leads compared to other channels?
When these data streams connect, you get a complete picture of the event's lifecycle and its impact on the business.
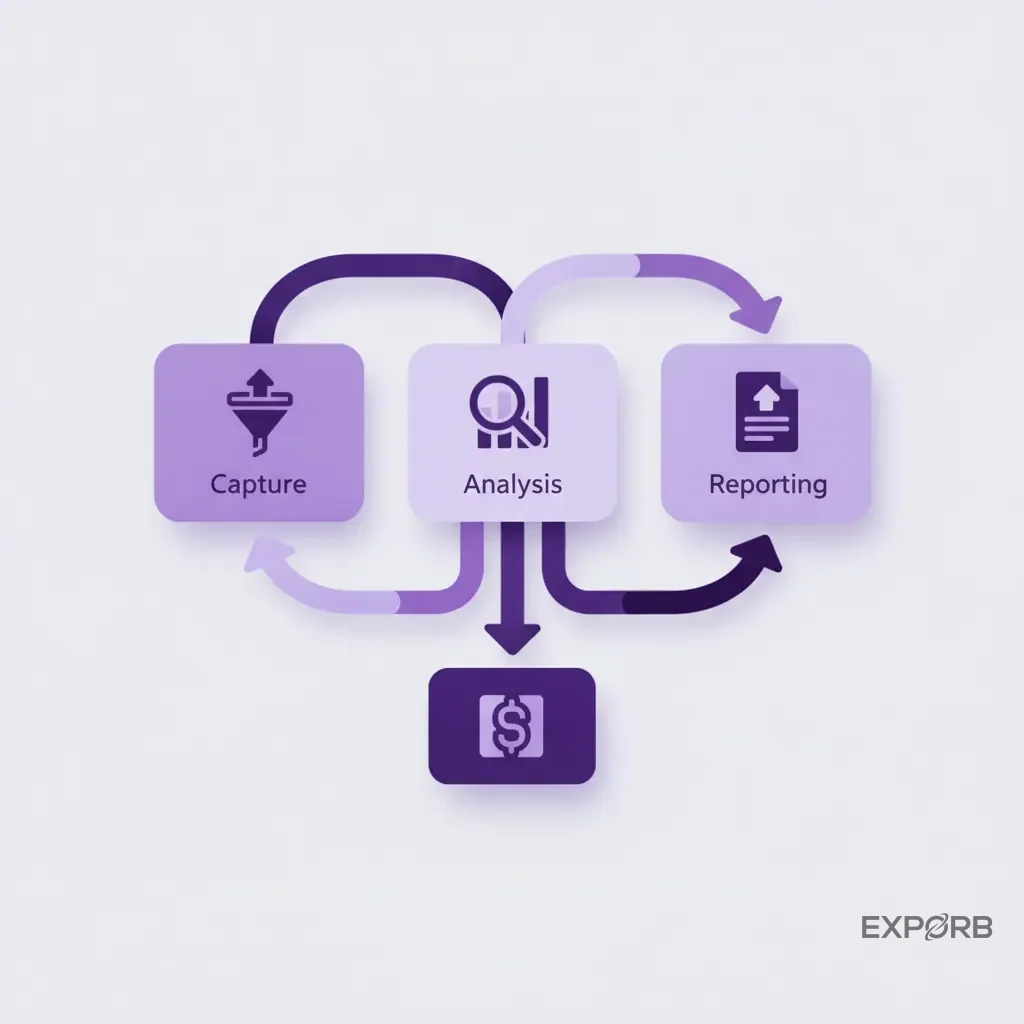
The three pillars: capture, analysis, and reporting
Think of your framework as having three essential pillars:
- Capture: This is your foundation. You need a standardized, efficient way for your entire team to capture rich, structured data at the booth. This means moving beyond flimsy business cards and basic badge scanners.
- Analysis: Once you capture the data, you need to analyze it—ideally in real time. This involves scoring leads, transcribing conversations, and identifying trends as they happen, not a week later.
- Reporting: Finally, you need to visualize this data in a way that's meaningful to different stakeholders. Your sales team needs a leaderboard. Your marketing team needs pipeline influence. Your C-suite needs ROI.
Get these three pillars right, and you'll transform your event program from a cost center into a predictable revenue driver. What's stopping you?
Related: The Complete Trade Show Lead Capture Guide
Mastering real-time analytics on the trade show floor
What if you could know which of your booth reps is having the most valuable conversations while the show is still happening? What if you could prioritize your hottest leads for immediate follow-up before they've even left the convention center? This isn't futuristic; it's what real-time trade show analytics and reporting enables. The game is won or lost on the floor, and waiting until you're back in the office to analyze what happened means you've already lost. Don't wait.
Using booth traffic and dwell time to optimize staffing
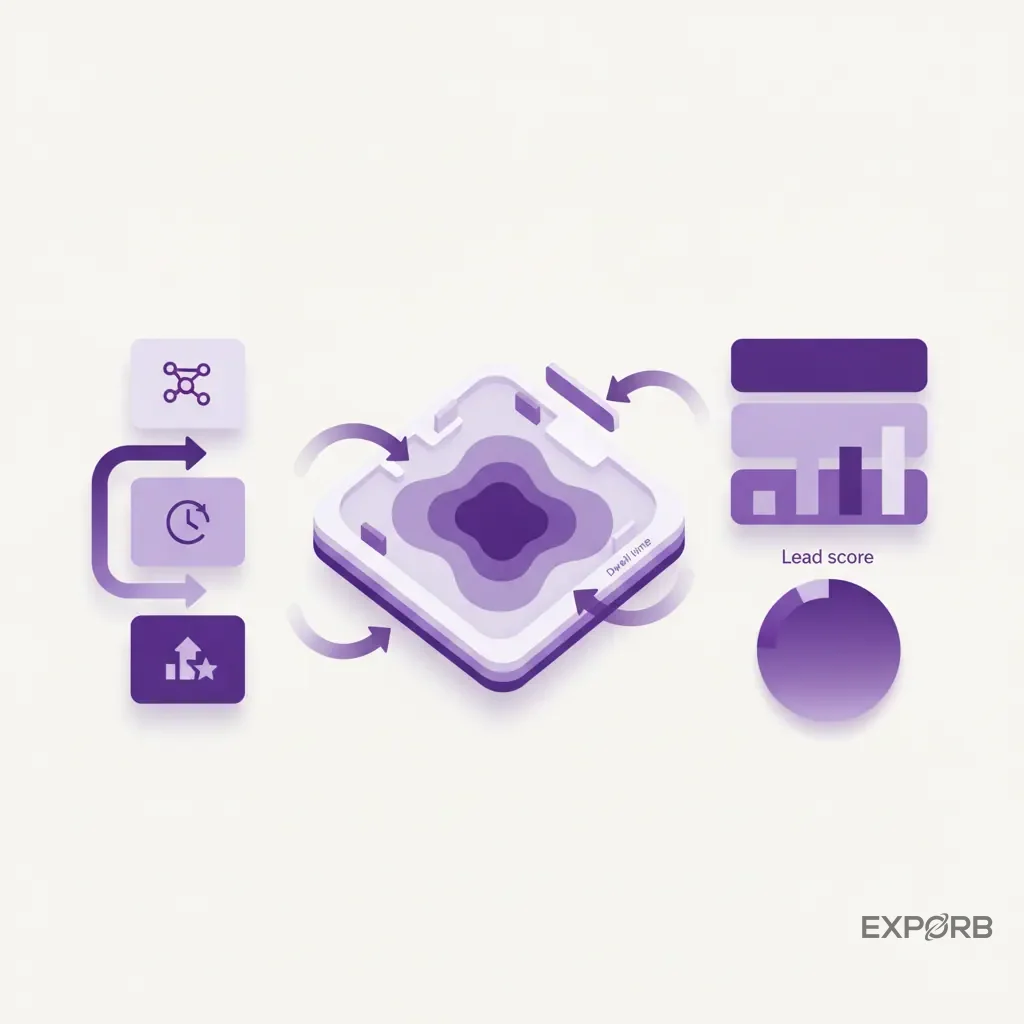
Are people congregating around your product demo station but leaving because there's no one to talk to? Are they spending an average of 10 seconds at your welcome desk and 3 minutes at the technical Q&A area? Booth traffic and dwell time analytics—often gathered through simple sensors or app data—can give you immediate insight into how attendees interact with your space. You can reallocate staff on the fly, moving your product experts to the busiest zones so you don't miss opportunities due to poor coverage. Optimize on the fly.
Capturing qualitative conversation data as it happens
This is the single biggest failure of traditional lead capture. A rep has a fantastic 15-minute conversation, learns about a prospect's budget, timeline, and key challenges, then scans their badge and jots down "good chat, follow up" on the back of a business card. The value is lost. A huge missed opportunity.
Modern tools allow your team to capture this rich, qualitative data instantly. Instead of scribbling notes, they can record a quick voice memo summarizing the conversation right in the app. The audio gets captured, attached to the lead's profile, and can be transcribed later. Now, you have a searchable, shareable record of the actual conversation, preserving every important detail for a highly personalized follow-up.
AI-powered lead scoring for immediate sales prioritization
Not all leads are created equal. A student collecting research is different from a VP of Engineering at a target account who just said, "We need to solve this in the next six months." But in a traditional system, they both look like just another badge scan. AI changes everything.
By analyzing the data captured during the conversation—job title, company size, keywords mentioned in the notes—an AI lead scoring system can assign a priority score in real time. Your team sees a live dashboard: Lead A is a 95/100, Lead B is a 60/100, and Lead C is a 20/100. This allows your sales development reps (SDRs) to immediately begin outreach to the hottest leads, striking while the iron is hot, instead of waiting a week for a giant, unsorted spreadsheet.
How can you automate data collection to improve accuracy and speed?
Manual data entry is the biggest bottleneck in event analytics. It's slow, prone to errors, and your sales team absolutely hates doing it. It's time to stop. According to research from WifiTalents, approximately 81% of trade show attendees have buying authority. Automating data collection ensures you don't fumble these high-value opportunities with sloppy data. The goal is to get clean, structured data from the booth into your system of record with as little friction as possible.
Beyond badge scanners: AI-powered business card scanning
Let's be honest: business cards aren't going away completely. But manually typing them into a spreadsheet is a nightmare. Typos are common, fields get mixed up, and it can take days to process a few hundred cards.
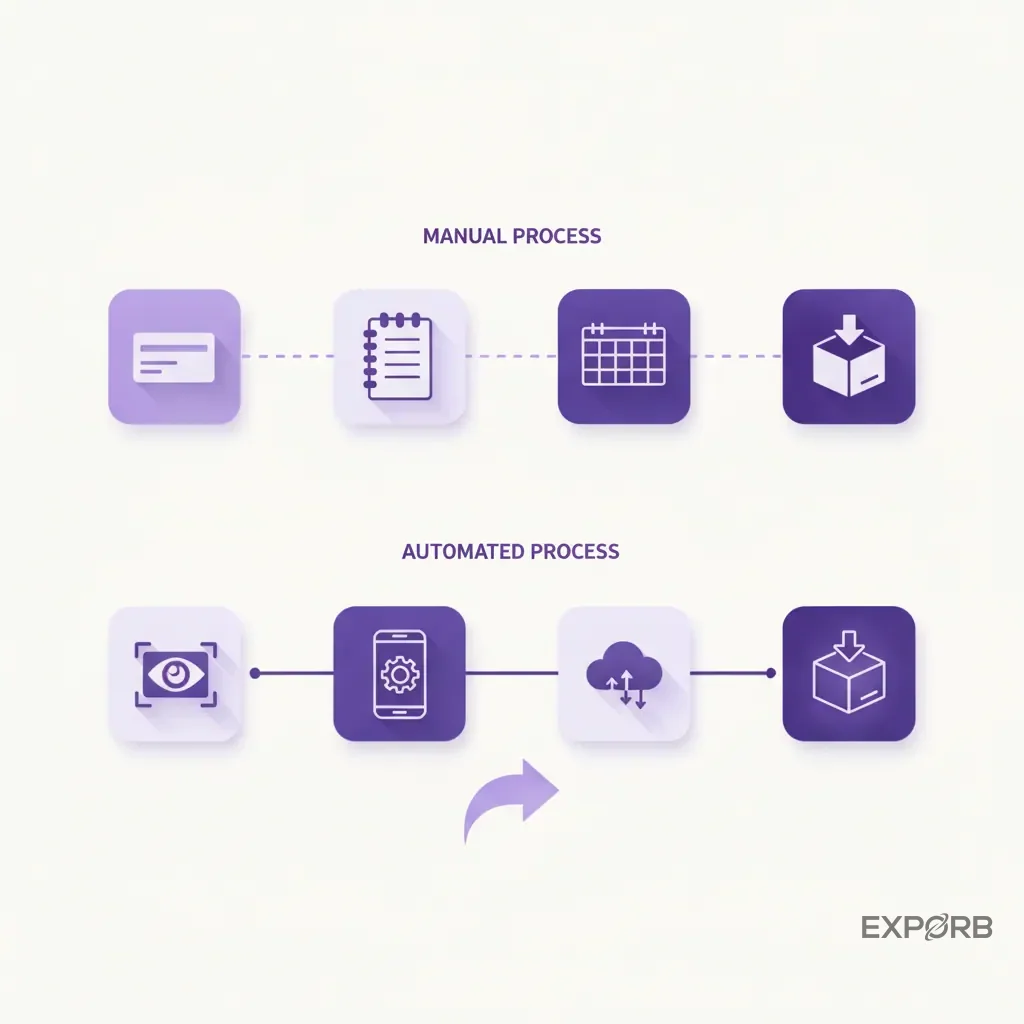
The modern solution is an AI-powered business card scanner. Your team simply takes a photo of the card with their phone. We built Exporb's app with optical character recognition (OCR) to instantly and accurately pull the name, title, company, email, and phone number into a new contact record. It's faster, more accurate, and it works for cards in any language or format. No more "data entry parties" back at the office. We built Exporb's app for speed. Your team can scan a card and add notes in under 30 seconds.
Offline audio transcription for capturing rich conversation details
What happens when the convention center Wi-Fi inevitably fails? Most cloud-based apps become useless bricks. This is a critical failure point for many event tech solutions. Your data capture process must work offline. No Wi-Fi? No problem.
A solid lead capture tool should be built with an offline-first architecture. This means your team can continue to scan cards, record voice notes, and take photos even without an internet connection. The data saves securely on their device. As soon as they're back online—at the hotel, at the airport—the app automatically syncs all the captured data to the cloud. This is where AI features like audio transcription kick in, turning those offline voice notes into searchable text without your team having to do a thing. It's the best of both worlds: reliable offline capture on the floor and powerful AI enrichment when connected.
Connecting your event tech stack directly to your CRM
The final step in automation is closing the loop with your CRM. Exporting a CSV file and then manually importing it into Salesforce or HubSpot is an outdated workflow. It creates duplicates, requires manual field mapping, and delays the handoff to sales. Stop the manual transfers.
Look for tools that offer direct CRM integrations or clean data exports. With a single click, you should be able to push an enriched lead—complete with contact info, conversation notes, and a priority score—directly into your sales team's workflow. This smooth handoff ensures high-priority leads get actioned within hours, not days, dramatically improving conversion rates.
What are the essential KPIs for your trade show dashboard?
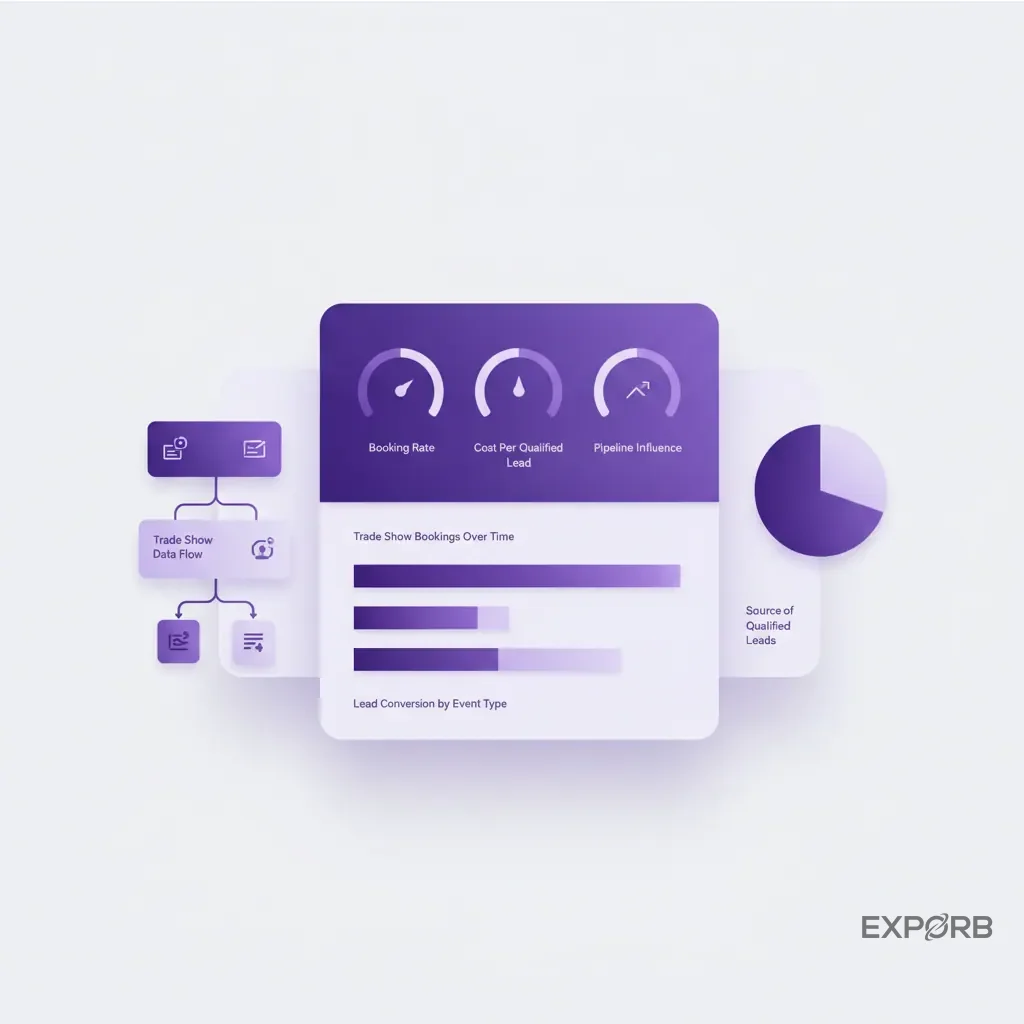
You can't improve what you don't measure. But tracking dozens of metrics is just as bad as tracking none at all. Focus on what counts. A great trade show dashboard focuses on a handful of key performance indicators (KPIs) that directly reflect the health and ROI of your event strategy. These metrics should span the entire event lifecycle, from pre-show planning to post-show revenue impact.
Pre-show metrics: meeting booking rates and target account engagement
Your event's success often gets determined before you even set foot on the plane. These KPIs tell you if your pre-show outreach is working.
- Meeting Booking Rate: Of the target accounts you invited, what percentage booked a scheduled meeting or demo at your booth? This is a primary indicator of intent.
- Target Account Engagement: Are key contacts from your target account list opening your pre-show emails? Are they visiting your event landing page? Tracking this digital body language helps you prioritize your outreach.
Onsite metrics: leads per rep, conversation quality score, and cost per qualified lead
These metrics give you a real-time pulse on your team's performance on the show floor.
- Leads Per Rep: A simple but effective way to measure individual performance and identify top performers or those who may need coaching. A live leaderboard can encourage friendly competition.
- Conversation Quality Score (CQS): This is a more advanced metric. It's a score (e.g., 1-5) assigned by the rep after each conversation, indicating the quality and potential of the lead. It helps you distinguish a tire-kicker from a hot prospect.
- Cost Per Qualified Lead (CPQL): This is where the rubber meets the road. Divide your total event cost by the number of qualified leads (based on your CQS or other criteria). This is far more meaningful than the generic Cost Per Lead.
Post-show metrics: pipeline influence, sales cycle velocity, and Event ROI
This is what your leadership team cares about. These metrics prove the event's business value.
- Pipeline Influence: Of the total sales pipeline created in the quarter following the event, what percentage (by dollar amount) was sourced from or influenced by the event? This is your key metric for proving impact.
- Sales Cycle Velocity: How quickly do event-sourced leads move through the sales funnel compared to leads from other channels? A faster velocity often indicates higher lead quality.
- Event ROI: The most important metric. The formula is:
(Pipeline Generated - Event Cost) / Event Cost. An industry benchmark from TradeShowPro suggests a healthy average is around 4.5:1.
Essential KPIs for your trade show analytics dashboard
The hot and not of trade show reporting in 2026
Companies are shifting how they report on trade show performance. The static, rearview-mirror reports of the past are being replaced by dynamic, forward-looking intelligence dashboards. If your reporting process still involves VLOOKUP in Excel a week after the show, you're falling behind. Out with the old, in with the new.
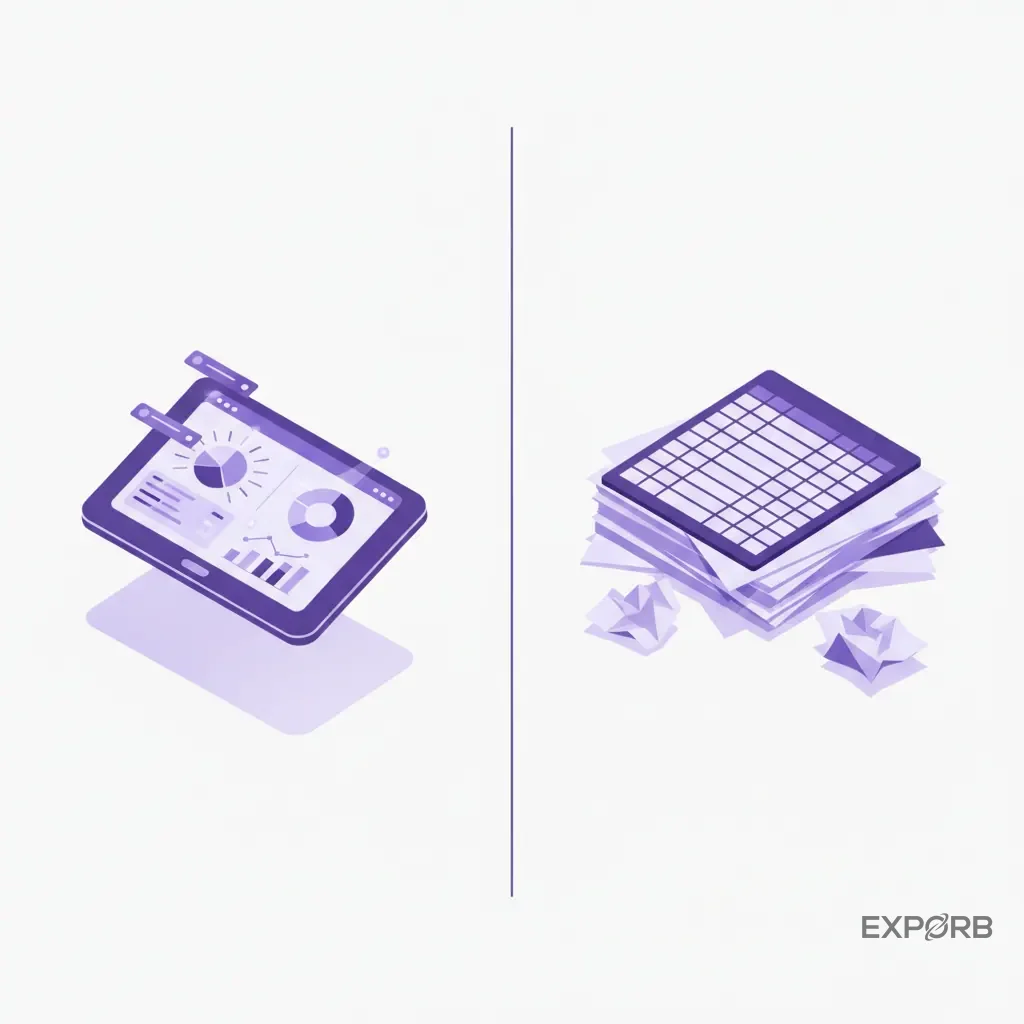
Hot: Integrated business intelligence and visualization tools
What's hot is connecting your event data directly to a BI tool like Tableau, Power BI, or even Google Looker Studio. This allows you to create dynamic, interactive dashboards that stakeholders can explore themselves. They can filter by rep, by product interest, or by region. The data is live; reports update as new leads sync from the show floor. It's about providing self-serve access to insights, not emailing around a static PDF.
Not: Static spreadsheets and manual data entry
What's not hot? The "master spreadsheet." It's the file that lives on a shared drive, three different people update manually, and it's riddled with inconsistencies, duplicates, and typos. This process is inefficient, a security risk, and a data integrity nightmare. By the time the data is "clean," it's already stale, and your window for timely follow-up has closed. If your process relies on manually exporting and importing CSVs, it's broken.
Hot: Closed-loop reporting that connects events to revenue
The most important trend is closed-loop reporting. This means your event platform, Marketing Automation system, and CRM all speak the same language. You can track a lead from the moment they're scanned at the booth, through every marketing touchpoint, to the final closed-won deal in your CRM. This creates a complete, unbroken chain of data that allows you to definitively say, "This event generated $750,000 in revenue." This is the holy grail. That's the kind of reporting that gets you more budget, not less.
Related: How to Calculate Trade Show ROI (And Prove It to Your CFO)
How do you prove trade show ROI to your CFO and RevOps team?
Your CFO and RevOps leader speak the language of numbers, pipelines, and efficiency. They don't care about booth traffic or how many t-shirts you gave away. To get their buy-in and secure future event budgets, you need to present a data story that ties your event activities directly to financial outcomes. It's about shifting the conversation from "we had a great show" to "the show generated a 5:1 return on investment." Show them the money.
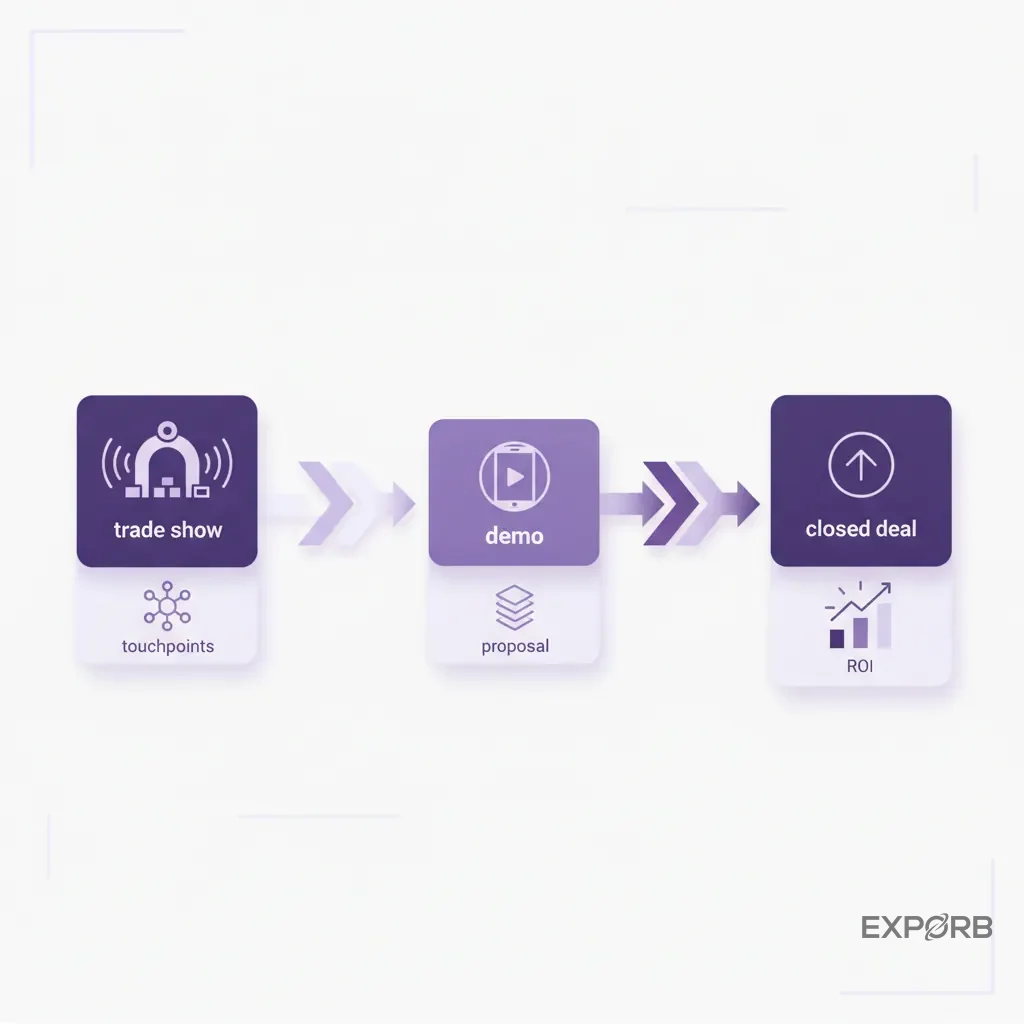
Building a credible event attribution model
Attribution is the holy grail of marketing analytics. A simple "first-touch" or "last-touch" model often misleads. A multi-touch attribution model is more accurate. It assigns partial credit to every touchpoint in the buyer's journey. For events, this means you need to track:
- Sourced by Event: Deals where the trade show was the very first interaction with the prospect.
- Influenced by Event: Deals where the prospect was already in your pipeline, but a key conversation at the event accelerated the deal or increased its value.
Configure your CRM to track both. This provides a much more honest and complete picture of the event's impact.
Benchmarking event performance against other marketing channels
How does your cost per qualified lead (CPQL) from trade shows compare to your CPQL from Google Ads or LinkedIn campaigns? How does the average contract value (ACV) of event-sourced deals compare to inbound leads?
Presenting your event data in the context of your other marketing channels is powerful. It helps the finance team understand where events fit into the overall go-to-market strategy. If you can show that events produce larger deals that close faster, even with a higher initial cost, you've made a compelling business case. B2B exhibitors report that trade shows can influence 40–50% of their annual sales pipeline, per TradeShowPro, making this benchmark critical.
Presenting a data story that speaks to pipeline and revenue
Tell a story with your data.
- Start with the investment: "We invested $120,000 in the SAAS North conference."
- Show the activity: "Our team had 230 qualified conversations, leading to 85 marketing-qualified leads."
- Connect to pipeline: "From those MQLs, we've generated $680,000 in new sales pipeline to date."
- Forecast the revenue: "Based on our historical 25% close rate, we project this event will result in $170,000 of closed-won revenue."
- State the ROI: "That represents a projected ROI of 42% on our initial investment."
This is a narrative a CFO can understand and support. It's clear, credible, and focused on business results.
Can small teams use advanced analytics without enterprise tools?
You don't need a six-figure BI platform and a dedicated data scientist to implement a modern analytics framework. The idea that sophisticated trade show analytics and reporting is only for large enterprises is a myth. It's not just for the big guys. Thanks to a new generation of smart, accessible tools, even small teams and startups can punch well above their weight. The key is to be strategic and focus on the tools and metrics that deliver the most value.
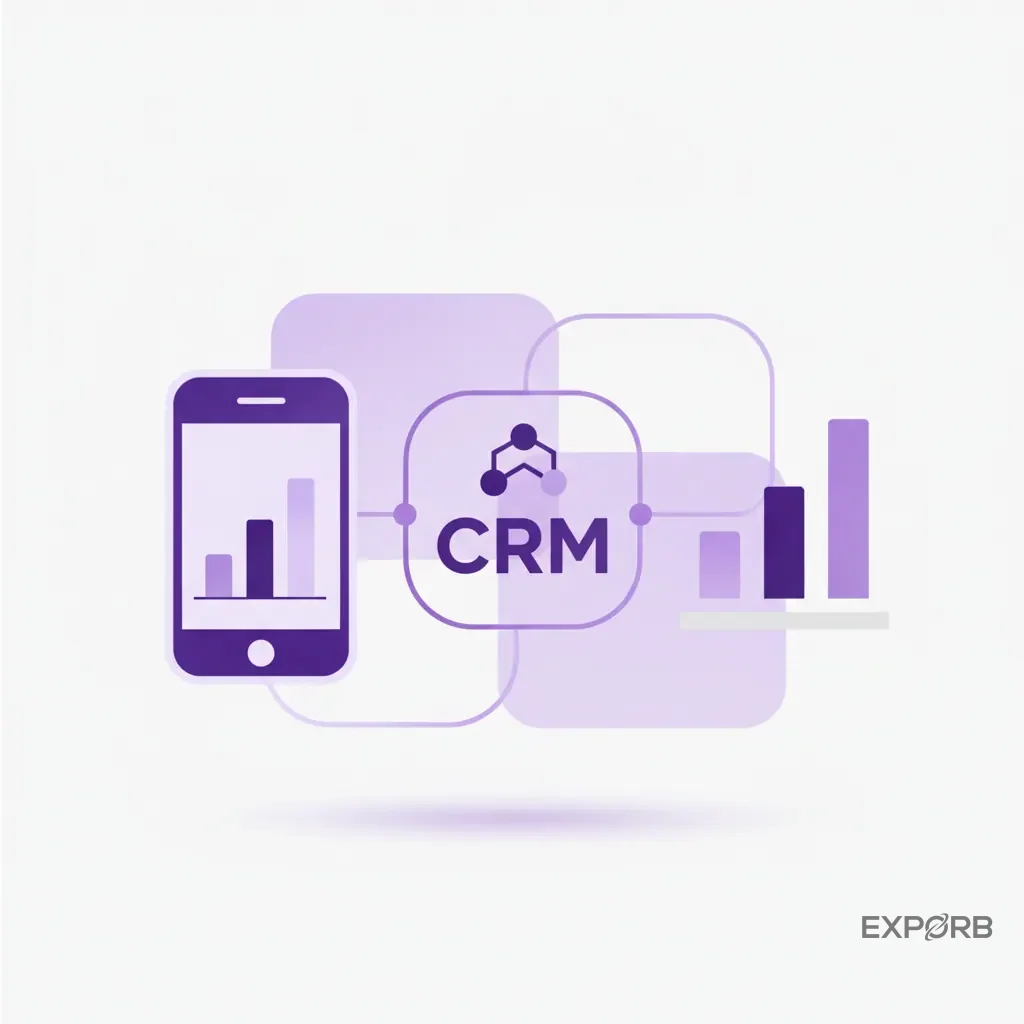
Using modern CRMs with built-in event features
Many modern CRMs (like HubSpot, Zoho, and others) have surprisingly powerful built-in campaign tracking and dashboarding features. You can create a "Trade Show" campaign in your CRM and associate every lead from that event with it. This allows you to build simple reports that track the conversion rates and pipeline generated from that specific campaign, separating it from all your other marketing activities. You don't need a separate system—you just need to use your existing CRM more effectively.
Using AI-powered mobile apps for on-the-go data capture
This is the biggest advantage for lean teams. You don't need to rent clunky, expensive badge scanners from the event organizer. A single mobile app can handle everything. Your team can use their own smartphones to scan business cards, record voice notes about conversations, and score leads in real time.
At Exporb, we designed our app to put the power of an entire event tech stack into your team's pocket. It works offline, syncs automatically, and uses AI to enrich data and draft personalized follow-up emails right from the booth. This levels the playing field, allowing a two-person startup team to be just as efficient and data-driven as a 50-person enterprise team. Level the playing field.
Focusing on a few key metrics that truly matter for growth
A small team can't track 50 different KPIs. And you shouldn't try. Focus on the vital few that are most closely tied to revenue growth. For most small businesses, these are:
- Cost Per Qualified Lead (CPQL): Are we spending our money efficiently?
- Pipeline Influence: Is this event actually creating sales opportunities?
- Sales Cycle Velocity: Are these leads high-quality and moving forward?
- Meeting Booking Rate: How well are we generating pre-show interest?
If you track just these four metrics consistently across all your events, you'll have a better handle on your performance than 90% of exhibitors. Start simple, be consistent, and build from there.
Integrating trade show data into your ABM strategy
For B2B companies running an Account-Based Marketing (ABM) strategy, trade shows are a goldmine of intelligence. An event is one of the few places where you can have multiple, high-bandwidth conversations with key stakeholders from your most important target accounts—all in one place. But if you don't capture and integrate that data properly, you waste the opportunity. Don't waste the opportunity. Your event data should be a primary fuel source for your ABM engine.
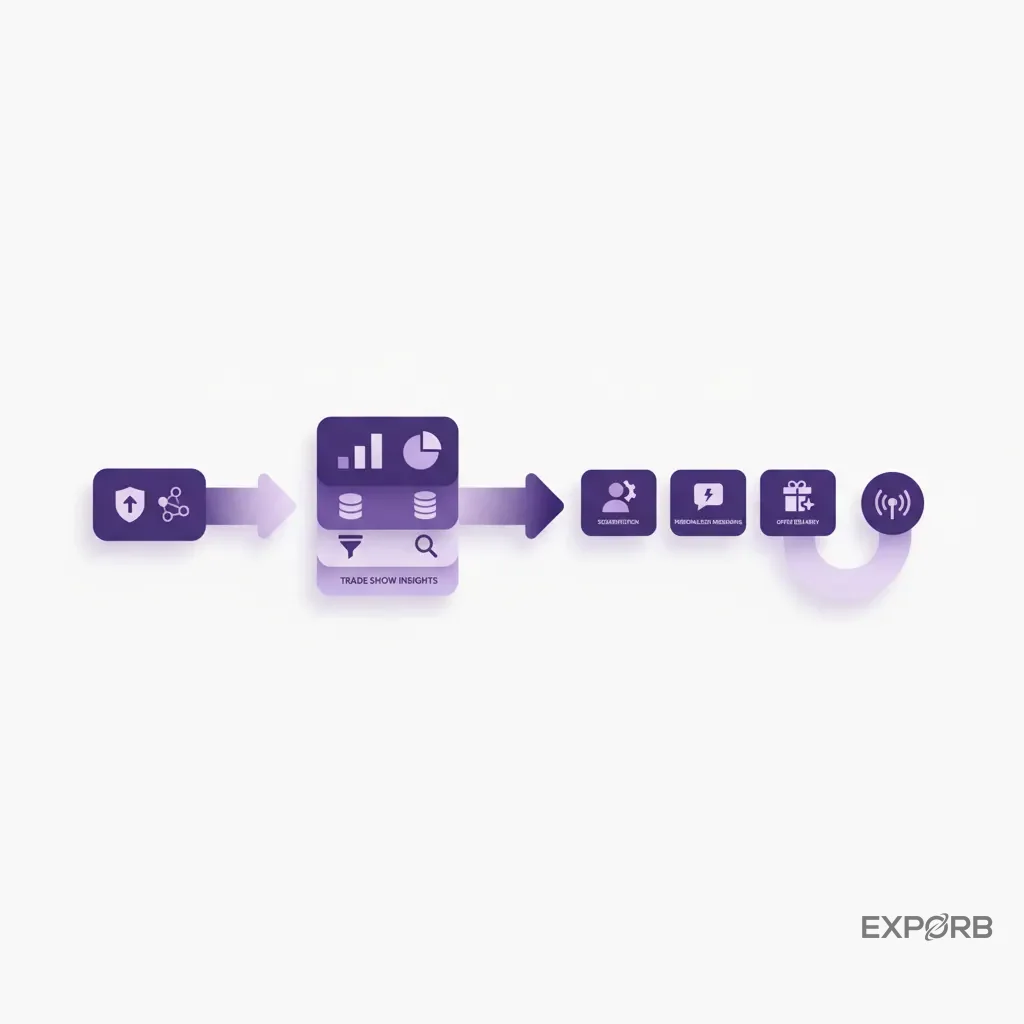
Mapping onsite interactions to target account lists
Before the event, your ABM team should provide the booth staff with a priority list of target accounts. Your lead capture tool should make it easy to flag a new contact as belonging to one of these target accounts. When your team scans the card of an engineer from "Acme Corporation" (a tier-1 target), the system should immediately recognize and tag it. This allows you to track your penetration and engagement with key accounts in real-time throughout the show. At the end of day one, you can run a report: "How many of our top 50 target accounts have we spoken to?"
Using conversation insights to personalize post-event follow-up
This is where you can create a massive competitive advantage. While your competitors send generic "Nice to meet you at the show" emails, you can use the detailed conversation data you've captured to craft hyper-personalized outreach.
Imagine your rep recorded a voice note: "Spoke with Sarah from Acme Corp. She's struggling with data integration for their new ERP system and needs a solution that works with SAP. Her boss, John, is the final decision-maker."
Your ABM follow-up can now be incredibly specific. You can send Sarah a case study about your SAP integration and simultaneously launch a targeted ad campaign to John on LinkedIn. This level of personalization, powered by real conversation data, is what turns a good lead into a closed deal.
Measuring account-level engagement across your event portfolio
Don't just look at events in isolation. Track account engagement across your entire event program. Your analytics should answer questions like: "How many times have we interacted with someone from Acme Corporation across the five trade shows we attended this year?" This portfolio-level view helps you identify which accounts are most engaged and most likely to buy. It also helps you justify your overall event strategy by showing how repeated, in-person touchpoints contribute to winning your most important accounts.
Your action plan for a data-driven 2027 event season
Talking about a data-driven strategy is easy. Implementing one takes planning and discipline. As you look ahead to your 2027 events, don't fall back into old habits. Use this simple, three-step action plan to build a foundation for a more measurable, high-ROI event program. The global events industry is projected to hit $2.33 trillion by 2026 according to Vendelux, and you need a plan to capture your share. Ready for 2027?
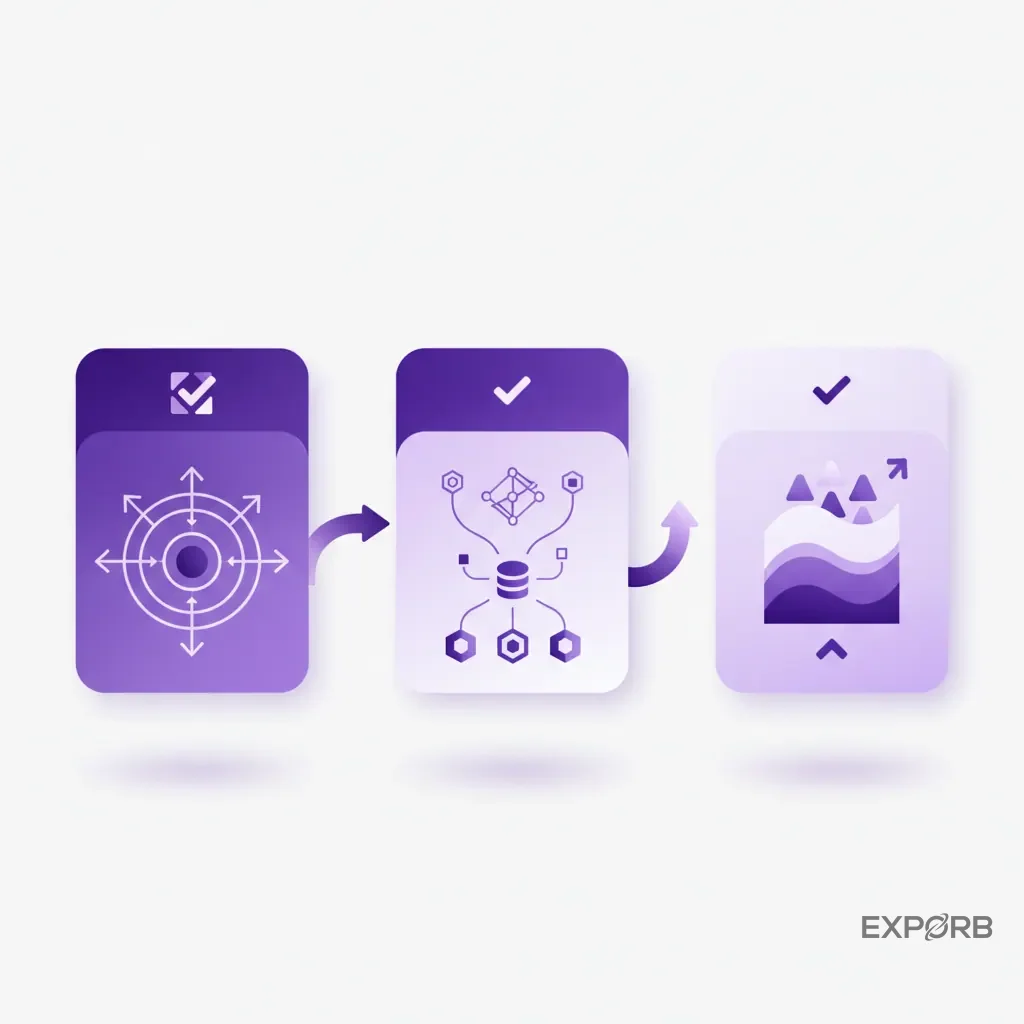
Step 1: Define your goals and success metrics before booking
Before you sign a single contract or book a flight, sit down with your sales and marketing leadership. What is the primary business goal for this event? Is it to generate net-new pipeline? Accelerate existing deals? Build brand awareness in a new market? Your goal will determine your KPIs.
- If the goal is pipeline generation, your primary KPI is Pipeline Influence.
- If the goal is deal acceleration, your primary KPI is Sales Cycle Velocity for influenced accounts.
- If the goal is brand awareness, your KPIs might be press mentions and share of voice.
Agree on these metrics before the event. This means everyone is aligned and prevents you from trying to define success after the fact.
Step 2: Choose a tech stack for smooth data capture and integration
Your technology choices will make or break your analytics strategy. You need a simple, integrated stack that your team will actually use. At a minimum, you need:
- A Mobile Lead Capture App: It must work offline, scan business cards accurately, and allow for rich data capture like voice notes and photos. This is your single source of truth on the floor. Check that your solution provides solid team sync and collaboration features.
- Your CRM: This is your system of record. Ensure your lead capture app can integrate smoothly with it to avoid manual data transfer.
Don't overcomplicate it. A great mobile app and a well-configured CRM are all you need to get started.
Step 3: Train your team on a standardized process for data entry and qualification
A tool is only as good as the process around it. Before the event, hold a mandatory training session with every single person who will be working the booth.
- Standardize Data Capture: Show them exactly how to use the app. Define what fields are required for every new lead.
- Define Lead Qualification: Create a simple, clear definition for your "Conversation Quality Score." What does a 1-star conversation look like versus a 5-star one? Give concrete examples.
- Role-Play: Do a few practice runs. Have them scan a card, add a voice note, and qualify a lead. This builds muscle memory and ensures everyone's comfortable with the process before the chaos of the show floor begins.
A standardized process ensures the data you collect is clean, consistent, and—most importantly—trustworthy. Without that foundation, all the advanced reporting in the world won't help you.